Combining ecology with spatial data: New book delivers toolbox for ecologists
In a new book providing a guided walkthrough and toolbox to conduct population and ecosystem modeling at high-spatial resolution, James Thorson (SAFS alum and affiliate faculty, and Statistical Ecologist at NOAA) has co-authored Spatio-Temporal Models for Ecologists with Kasper Kristensen. Coming up with the idea for the book during a meeting at SAFS almost a decade ago, we sat down with James to find out more about why it’s a useful tool for ecologists.
Tell us what was the impetus behind writing a book on this topic, and what new insights into ecology it provides?
Most efforts to determine whether ecosystems are managed sustainably in ecology and fisheries have tracked total abundance for specific populations, species, or communities. But the increased challenges presented by climate and its impact on spatial management means we need to transition from concepts of ecology measuring population abundance, to instead use fine-scale spatial information on population densities in different habitats.
Why is this work important? Because much of our policy is written to achieve sustainability for an entire population. These are blunt indicators for questions such as: are we catching too many fish, do we have too few wetlands, have we paved too many meadows for bees? However, these indicators then bring us to the solutions side. Problems are global, solutions are local. For most people, issues like changing sea ice in the Arctic are more impactful when they understand how it affects their local community. Ecology shouldn’t just be highlighting big trends, but also direct us to local solutions. Spatial analysis allow us to identify both local and regional solutions to issues of sustainability.
So, the book is intended to be a guided walkthrough using a minimal set of tools for people working in applied ecology that can be used to implement a wide range of real-world ecological problems. We use varied examples including fish species from Alaska, birds from the western United States, movement models of northern fur seals, and ozone concentrations on the east coast. For example, one example used a technique called “Empirical Orthogonal Functions” to show that declining summer sea ice in the Arctic could be explained by two dominant patterns, including a decrease in sea ice near Russia around 2005, and a separate pattern of decreasing sea ice in the Pacific gateway (north of Alaska) in 2007 and again in 2012 (Fig. 1). These high-level patterns aren’t so obvious when just looking at annual sea ice patterns (Fig. 2), and simplifying the patterns then moves the conversation forward by emphasizing different local impacts of a global pattern.
-
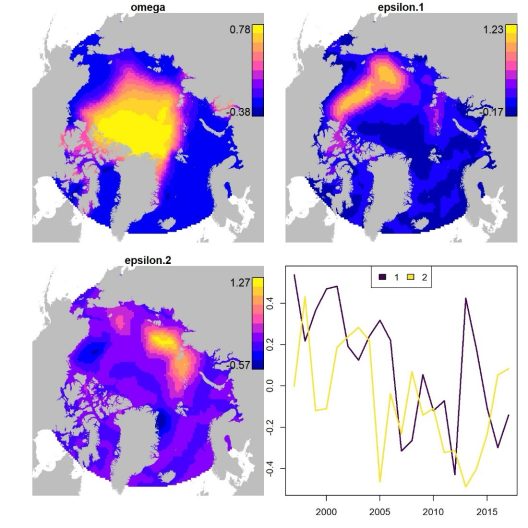
- Empirical orthogonal function model components that explain summertime Arctic sea ice concentrations, including the average spatial component (top-left panel), the spatial response for both models (top-right and bottom-left), and the temporal index associated with each mode (bottom-right).

-

- Predicted concentration of sea ice in September from 1997 to 2017 fitted using a spatio-temporal index model, based on satellite measurements and restricted to locations within 3000 km of the north pole.

Who did you write this book for?
There are plenty of textbooks on statistical theory written for graduate students in statistics, and others which focus on basic analyses using free software like R. However, for ecologists, we find that the former may be too complicated, and the latter can only implement a relatively small set of canned analyses. What our book aims for is the middle ground, where people can build custom tools using minimal code – snippets that people can snap together like Legos – and build exactly what they want out of a spatial model for their ecological questions. Custom-built tools such as these then allow ecologists to address the specific context and questions that local stakeholders care about. These custom-build models are widely used in managing fish, birds, and mammals, where they’re called stock assessments or integrated population models. In some sense, the book aims to do the same thing for spatial statistics, so ecologists can combine their ecological expertise with spatial data.
In every fisheries science lab across the country, there are numerous people working in specialized spatial analysis. I think that this book will be an essential tool for their work. It’s also useful for all realms of study – terrestrial and aquatic species, mobile animals and plants growing in fixed locations. And that’s because we’re presenting the math and then breaking it down into computer steps and code, all hosted in a GitHub repository, that people can reuse. For example, we show how to combine data from three different sampling programs, which measure presence/absence, numbers, and biomass of red snapper in different portions of the Gulf of Mexico (Fig. 3). Existing software packages aren’t available to deal with a complicated setting like this, but it’s straightforward when you can customize the model using high-level code. Spatial statistics isn’t something which most ecologists learn, but it’s very useful and widely applicable in fisheries science and ecology.

Share with us some of the things in your book that will be useful for ecologists?
I’ve always loved how ecosystems change across landscapes and have been very interested in how spatial patterns change with climate change. Spatial information is extremely important when asking and answering questions around conservation science and resource management. But these fields usually use stock assessment models and integrated population models to take a bunch of data and make it into policy-relevant information. I think our toolbox should be co-equal with that effort, by assisting with spatial knowledge on how to help humans do their activities sustainably in different parts of the landscape. This is the first book to show how we can conduct this custom-built spatial analysis that’s driven by questions versus what software is available and accessible.
My co-author, Kasper Kristensen, build the Template Model Builder (TMB) software which is reused in many different applications. A big chunk of this book is laying out how to use their powerful piece of software in an understandable way. The first two chapters in particular are a guided introduction to TMB. Another useful part of the book is that it uses entirely open source, free-to-use software such as R, and computational heavy work with TMB. This addresses part of the need for this book, which is that many ecologists use accessible software like R, versus tools only existing behind paywalls.
What was the process like for you, writing a book?
One of the special things we’ve found about writing a book is we can take a decade of work and amalgamate it in one book – this isn’t always possible in research papers which have to be a lot shorter, each emphasizing some novel advance in isolation. With this book, which was a really fun and rewarding process to brainstorm and write over the last decade, we have a lot more discretion in telling the whole story around our topic. This book brings together lots of terminology and software and condenses it into a minimal set of principles and numerical techniques for ecologists in different fields. Our previous developments have been scattered across over 100 papers in a wide range of journals, and it can take years for new students or researchers to put the story together. We hope that our book provides a fun and gentle introduction to both the statistics and ecology involved in finding local solutions for global environmental problems.
